
how to simulate hard disk latency#
linux: how to simulate hard disk latency? I want to increase iowait value without using a cpu power#
https://serverfault.com/questions/523509/linux-how-to-simulate-hard-disk-latency-i-want-to-increase-iowait-value-withou
device-mapper “delay” devices#
Look at the “delay” target for device-mapper devices. This is exactly why it exists.
Example#
Here’s an example of how to get that going:
Create a place to read/write from#
[root@centos6 ~]# dd if=/dev/zero of=/tmp/100M-of-zeroes bs=1024k count=100
100+0 records in
100+0 records out
104857600 bytes (105 MB) copied, 0.141834 s, 739 MB/s
Make it into a block device#
Dev-mapper only maps from one block device to another, not between files and block devices. That’s the job of the loopback device.
[root@centos6 ~]# losetup --show --find /tmp/100M-of-zeroes
/dev/loop0
Get the device size in blocks#
Since this is what dev-mapper will need here in a moment…
[root@centos6 ~]# blockdev --getsize /dev/loop0
204800
Set up a “slow” device#
# echo "0 204800 delay /dev/loop0 0 200" | dmsetup create dm-slow
(about a 30 second pause here with no output)
The fields in the device mapper setup table in the “echo” command above are:
starting sector of this section of the device mapper device (
0)number of sectors of this section of the device mapper device (
204800)the type of device mapper device for this section (
delay)the first argument to “delay”, which is the device to use for real reads/writes after the delay (
/dev/loop/0)the second argument to “delay” which is the offset in the source device to use (
0)the third argument to “delay” which is the ms of time to delay reads (or reads and writes if no further parameters are specified.) (
200)
We only have one line since we’re treating the entire device mapper device the same, but this lets you have different sectors with different backing devices, only have some of them slow, only having some of them give errors, etc.
See https://linux.die.net/man/8/dmsetup for more info, including the possibly-also-useful “flakey” mapper type. Authoritative documentation on device-mapper’s delay feature is at https://www.kernel.org/doc/Documentation/device-mapper/delay.txt
Is it slow?#
[root@centos6 ~]# dd if=/dev/mapper/dm-slow of=/dev/null count=25000
25000+0 records in
25000+0 records out
12800000 bytes (13 MB) copied, 10.2028 s, 1.3 MB/s
Yeah, that’s pretty slow, especially compared to the original:
[root@centos6 ~]# dd if=/dev/loop0 of=/dev/null count=25000
25000+0 records in
25000+0 records out
12800000 bytes (13 MB) copied, 0.0361308 s, 354 MB/s
So the mapped device is definitely introducing a delay.
Combine the above#
I intentionally broke things apart so the process was easy to follow. However, you could easily combine steps above into fewer commands.
Emulate a slow block device with dm-delay#
https://www.flamingbytes.com/blog/emulate-a-slow-block-device-with-dm-delay/
Create dm-delay target#
Now, we use dmsetup utility to create a delayed target layer on top of the raw NVME. We specify the read delay as 50ms.
[root@perf-vm2 ~]# size=$(blockdev --getsize /dev/sdc)
[root@perf-vm2 ~]# echo $size
209715200

[root@perf-vm2 ~]# echo "0 $size delay /dev/sdc 0 50" | dmsetup create delayed
[root@perf-vm2 ~]# dmsetup table delayed
0 209715200 delay 8:32 0 50
[root@perf-vm2 ~]# ls -la /dev/mapper/ | grep delayed
lrwxrwxrwx  1 root root       7 May 19 18:37 delayed -> ../dm-3
Check the latency of dm-delay#
We can check the latency introduced by dm-delay while fio is running.
[root@perf-vm2 ~]# echo 3 > /proc/sys/vm/drop_caches
[root@perf-vm2 ~]# fio --blocksize=4k --ioengine=libaio --readwrite=read --filesize=5G --group_reporting --direct=1 --iodepth=128 --name=job1 --filename=/dev/dm-3
job1: (g=0): rw=read, bs=(R) 4096B-4096B, (W) 4096B-4096B, (T) 4096B-4096B, ioengine=libaio, iodepth=128
fio-3.7
Starting 1 process
^Cbs: 1 (f=1): [R(1)][4.3%][r=10.0MiB/s,w=0KiB/s][r=2562,w=0 IOPS][eta 08m:13s]
fio: terminating on signal 2
Jobs: 1 (f=1): [R(1)][4.5%][r=10.0MiB/s,w=0KiB/s][r=2562,w=0 IOPS][eta 08m:12s]
job1: (groupid=0, jobs=1): err= 0: pid=3138: Fri May 19 18:39:39 2023
   read: IOPS=2559, BW=9.00MiB/s (10.5MB/s)(229MiB/22905msec)
    slat (nsec): min=915, max=132881, avg=3115.23, stdev=3538.89
    clat (usec): min=49420, max=52624, avg=50006.18, stdev=201.19
     lat (usec): min=49424, max=52628, avg=50009.46, stdev=200.86
    clat percentiles (usec):
     |  1.00th=[49546],  5.00th=[49546], 10.00th=[49546], 20.00th=[50070],
     | 30.00th=[50070], 40.00th=[50070], 50.00th=[50070], 60.00th=[50070],
     | 70.00th=[50070], 80.00th=[50070], 90.00th=[50070], 95.00th=[50070],
     | 99.00th=[50594], 99.50th=[51119], 99.90th=[51119], 99.95th=[52691],
     | 99.99th=[52691]
   bw (  KiB/s): min= 9632, max=10520, per=99.81%, avg=10217.24, stdev=117.17, samples=45
   iops        : min= 2408, max= 2630, avg=2554.31, stdev=29.29, samples=45
  lat (msec)   : 50=52.82%, 100=47.18%
  cpu          : usr=0.11%, sys=1.20%, ctx=2973, majf=0, minf=161
  IO depths    : 1=0.1%, 2=0.1%, 4=0.1%, 8=0.1%, 16=0.1%, 32=0.1%, >=64=99.9%
     submit    : 0=0.0%, 4=100.0%, 8=0.0%, 16=0.0%, 32=0.0%, 64=0.0%, >=64=0.0%
     complete  : 0=0.0%, 4=100.0%, 8=0.0%, 16=0.0%, 32=0.0%, 64=0.0%, >=64=0.1%
     issued rwts: total=58624,0,0,0 short=0,0,0,0 dropped=0,0,0,0
     latency   : target=0, window=0, percentile=100.00%, depth=128

Run status group 0 (all jobs):
   READ: bw=9.00MiB/s (10.5MB/s), 9.00MiB/s-9.00MiB/s (10.5MB/s-10.5MB/s), io=229MiB (240MB), run=22905-22905msec

Disk stats (read/write):
    dm-3: ios=58624/0, merge=0/0, ticks=2925349/0, in_queue=2930643, util=99.66%, aggrios=58624/0, aggrmerge=0/0, aggrticks=65/0, aggrin_queue=65, aggrutil=0.06%
  sdc: ios=58624/0, merge=0/0, ticks=65/0, in_queue=65, util=0.06%
We can see that the r_await time is 50ms on dm-3 which is the dm-delay target on top of sdc.
[root@perf-vm2 ~]# iostat -ktdx 1
05/19/2023 06:39:35 PM
Device:         rrqm/s   wrqm/s     r/s     w/s    rkB/s    wkB/s avgrq-sz avgqu-sz   await r_await w_await  svctm  %util
sdc               0.00     0.00 2560.00    0.00 10240.00     0.00     8.00     0.00    0.00    0.00    0.00   0.00   0.00
dm-3              0.00     0.00 2560.00    0.00 10240.00     0.00     8.00   128.00   50.00   50.00    0.00   0.39 100.00
We also can specify the write latency(e.g. 100ms) as below.
[root@perf-vm2 ~]# echo "0 $size delay /dev/sdc 0 50 /dev/sdc 0 100" | dmsetup create delayed

[root@perf-vm2 ~]# dmsetup table delayed
0 209715200 delay 8:32 0 50 8:32 0 100

[root@perf-vm2 ~]# ls -la /dev/mapper/| grep delayed
lrwxrwxrwx  1 root root       7 May 19 18:41 delayed -> ../dm-3
We run the fio write against the dm-delay target.
[root@perf-vm2 ~]# echo 3 > /proc/sys/vm/drop_caches
[root@perf-vm2 ~]# fio --blocksize=4k --ioengine=libaio --readwrite=write --filesize=5G --group_reporting --direct=1 --iodepth=128 --name=job1 --filename=/dev/dm-3
job1: (g=0): rw=write, bs=(R) 4096B-4096B, (W) 4096B-4096B, (T) 4096B-4096B, ioengine=libaio, iodepth=128
fio-3.7
Starting 1 process
^Cbs: 1 (f=1): [W(1)][0.9%][r=0KiB/s,w=5125KiB/s][r=0,w=1281 IOPS][eta 17m:25s]
fio: terminating on signal 2

job1: (groupid=0, jobs=1): err= 0: pid=3210: Fri May 19 18:42:36 2023
  write: IOPS=1259, BW=5039KiB/s (5160kB/s)(53.0MiB/10772msec)
    slat (nsec): min=1771, max=49839k, avg=13004.20, stdev=591607.93
    clat (msec): min=99, max=174, avg=100.68, stdev= 6.72
     lat (msec): min=99, max=174, avg=100.69, stdev= 6.75
    clat percentiles (msec):
     |  1.00th=[  100],  5.00th=[  101], 10.00th=[  101], 20.00th=[  101],
     | 30.00th=[  101], 40.00th=[  101], 50.00th=[  101], 60.00th=[  101],
     | 70.00th=[  101], 80.00th=[  101], 90.00th=[  101], 95.00th=[  101],
     | 99.00th=[  102], 99.50th=[  169], 99.90th=[  174], 99.95th=[  174],
     | 99.99th=[  176]
   bw (  KiB/s): min= 3352, max= 5416, per=99.91%, avg=5033.62, stdev=396.81, samples=21
   iops        : min=  838, max= 1354, avg=1258.38, stdev=99.20, samples=21
  lat (msec)   : 100=52.92%, 250=47.08%
  cpu          : usr=0.29%, sys=0.74%, ctx=1123, majf=0, minf=30
  IO depths    : 1=0.1%, 2=0.1%, 4=0.1%, 8=0.1%, 16=0.1%, 32=0.2%, >=64=99.5%
     submit    : 0=0.0%, 4=100.0%, 8=0.0%, 16=0.0%, 32=0.0%, 64=0.0%, >=64=0.0%
     complete  : 0=0.0%, 4=100.0%, 8=0.0%, 16=0.0%, 32=0.0%, 64=0.0%, >=64=0.1%
     issued rwts: total=0,13569,0,0 short=0,0,0,0 dropped=0,0,0,0
     latency   : target=0, window=0, percentile=100.00%, depth=128

Run status group 0 (all jobs):
  WRITE: bw=5039KiB/s (5160kB/s), 5039KiB/s-5039KiB/s (5160kB/s-5160kB/s), io=53.0MiB (55.6MB), run=10772-10772msec

Disk stats (read/write):
    dm-3: ios=41/13568, merge=0/0, ticks=2118/1344129, in_queue=1351987, util=100.00%, aggrios=42/13569, aggrmerge=0/0, aggrticks=18/25, aggrin_queue=43, aggrutil=0.20%
  sdc: ios=42/13569, merge=0/0, ticks=18/25, in_queue=43, util=0.20%
The write latency on dm-3 is 100ms as below iostat shows.
[root@perf-vm2 ~]# iostat -ktdx 1
05/19/2023 06:42:33 PM
Device:         rrqm/s   wrqm/s     r/s     w/s    rkB/s    wkB/s avgrq-sz avgqu-sz   await r_await w_await  svctm  %util
sdc               0.00     0.00    0.00 1280.00     0.00  5120.00     8.00     0.00    0.00    0.00    0.00   0.00   0.00
dm-3              0.00     0.00    0.00 1280.00     0.00  5120.00     8.00   128.00  100.00    0.00  100.00   0.78 100.00
Suspending I/Os#
The device mapper can also suspend and resume I/Os.
[root@perf-vm2 ~]# dmsetup suspend /dev/dm-3
[root@perf-vm2 ~]# dmsetup resume /dev/dm-3
[root@perf-vm2 ~]# iostat -ktdx 1
05/19/2023 06:43:55 PM
Device:         rrqm/s   wrqm/s     r/s     w/s    rkB/s    wkB/s avgrq-sz avgqu-sz   await r_await w_await  svctm  %util
sdc               0.00     0.00    0.00 1073.00     0.00  4292.00     8.00     0.07    0.07    0.00    0.07   0.00   0.20
dm-3              0.00     0.00    0.00  945.00     0.00  3780.00     8.00    78.85   94.44    0.00   94.44   0.65  61.70

05/19/2023 06:43:56 PM
Device:         rrqm/s   wrqm/s     r/s     w/s    rkB/s    wkB/s avgrq-sz avgqu-sz   await r_await w_await  svctm  %util
sdc               0.00     0.00    0.00    0.00     0.00     0.00     0.00     0.00    0.00    0.00    0.00   0.00   0.00
dm-3              0.00     0.00    0.00    0.00     0.00     0.00     0.00     0.00    0.00    0.00    0.00   0.00   0.00


05/19/2023 06:44:06 PM
Device:         rrqm/s   wrqm/s     r/s     w/s    rkB/s    wkB/s avgrq-sz avgqu-sz   await r_await w_await  svctm  %util
sdc               0.00     0.00    0.00 1280.00     0.00  5120.00     8.00     0.08    0.06    0.00    0.06   0.02   2.80
dm-3              0.00     0.00    0.00 1280.00     0.00  5120.00     8.00   127.65  100.46    0.00  100.46   0.78 100.00
^C
Create a ramdisk#
If you want to emulate a fast disk without using NVME, the ramdisk(aka RAM backed disk) can be used. The size is capped by the physical RAM size.
# load the brd kernel module. rd_nr is the maximum number of ramdisks. rd_size is the ramdisk size in KB.
$ sudo modprobe brd rd_nr=1 rd_size=1048576

$ ls -l /dev/ram0
brw-rw---- 1 root disk 1, 0 Aug 24 20:00 /dev/ram0

$ sudo blockdev --getsize /dev/ram0 # Display the size in 512-byte sectors
2097152
Reference#
https://docs.kernel.org/admin-guide/device-mapper/delay.html
巧用Systemtap注入延迟模拟IO设备抖动#
From https://blog.yufeng.info/archives/2935
转载自系统技术非业余研究
本文链接地址: 巧用Systemtap注入延迟模拟IO设备抖动
当我们的IO密集型的应用怀疑设备的IO抖动,比如说一段时间的wait时间过长导致性能或其他疑难问题的时候,这个现象处理起来就比较棘手,因为硬件的抖动有偶发性很难重现或者重现的代价比较高。
幸运的是systemtap可以拯救我们。从原理上讲,我们应用的IO都是通过文件系统来访问的,不管read/write/sync都是,而且我们的文件大部分都是以buffered方式打开的。在这个模式下,如果pagecache不命中的话,就需要访问设备。 知道了这个基本的原理以后,我们就可以用万能的systemtap往vfs的读写请求中受控的注入延迟,来达到这个目的。
要点有以下几个:
受控的时间点。
延迟时间可控。
目标设备可控。
我写了个脚本注入IO延迟,模拟ssd/fio硬件的抖动来验证是否是IO抖动会给应用造成影响,三个步骤如下: 步骤1: 编译模块
$ ``cat` `inject_ka.stp
global inject, ka_cnt
probe procfs(``"cnt"``).``read` `{
 ``$value = sprintf(``"%d\n"``, ka_cnt);
}
probe procfs(``"inject"``).write {
 ``inject= $value;
 ``printf``(``"inject count %d, ka %s"``, ka_cnt, inject);
}
probe vfs.``read``.``return``,
   ``vfs.write.``return` `{
 ``if` `($``return` `&&
   ``devname == @1 &&
   ``inject == ``"on\n"``)
 ``{
  ``ka_cnt++;
  ``udelay($2);
 ``}
}
probe begin{
 ``println(``"ik module begin:)"``);
}
$ stap -V
Systemtap translator/driver (version 2.1/0.152, commit release-2.0-385-gab733d5)
Copyright (C) 2005-2013 Red Hat, Inc. and others
This is ``free` `software; see the ``source` `for` `copying conditions.
enabled features: LIBSQLITE3 NSS BOOST_SHARED_PTR TR1_UNORDERED_MAP NLS
$ ``sudo` `stap -p4 -DMAXSKIPPED=9999 -m ik -g inject_ka.stp sda6 300
ik.ko
其中参数sda6是目标设备的名字,300是希望延迟的时间,单位us(超过300很容易报错,因为通常systemtap会对脚本执行的cpu进行检查,占用过多cpu的时候会触发保护机制,导致stap抱怨退出),通常对于ssd设备是足够的。
这个步骤会生成ik.ko,请验证生成模块的机器和目标的机器,操作系统的版本是一模一样的,而且请确保你的stap版本比较高,因为udelay函数在高版本的Stap才有。
步骤2:
将ik.ko拷贝到目标机器,执行
$ ``sudo` `staprun ik.ko
ik module begin:)
步骤3: 启动应用程序开始测试后一段时间,运行如下命令开始注入:
$ ``echo` `on|``sudo` `tee` `/proc/systemtap/ik/inject && ``sleep` `10 && ``echo` `off|``sudo` `tee` `/proc/systemtap/ik/inject
其中sleep N 是希望打开注入开关的时间。
小结:systemtap用好很无敌!
使用SystemTap给I/O设备注入延迟#
From: https://bean-li.github.io/SystemTap-Inject-Latency/
前言#
当我们的IO密集型的应用怀疑设备的IO抖动,比如说某个磁盘的性能衰退,导致性能问题。这种故障一般需要有故障的硬盘才能测试。但是如何使用正常的硬盘模拟出块设备有较大的延迟呢?
阿里的褚霸有一篇文章《巧用Systemtap注入延迟模拟IO设备抖动》,使用SystemTap来模拟故障的设备。
global inject, ka_cnt

probe procfs("cnt").read {
  $value = sprintf("%d\n", ka_cnt);
}
probe procfs("inject").write {
  inject= $value;
  printf("inject count %d, ka %s", ka_cnt, inject);
}

probe vfs.read.return,
      vfs.write.return {
  if ($return &&
      devname == @1 &&
      inject == "on\n")
  {
    ka_cnt++;
    udelay($2);
  }
}

probe begin{
  println("ik module begin:)");
}

$ stap -V
Systemtap translator/driver (version 2.1/0.152, commit release-2.0-385-gab733d5)
Copyright (C) 2005-2013 Red Hat, Inc. and others
This is free software; see the source for copying conditions.
enabled features: LIBSQLITE3 NSS BOOST_SHARED_PTR TR1_UNORDERED_MAP NLS

$ sudo stap -p4 -DMAXSKIPPED=9999 -m ik -g inject_ka.stp sda6 300
ik.ko
但是霸爷的中心在vfs层注入延迟,如果我们关心块设备层,希望能够模拟出来块设备层的较高延迟,那么怎么做呢?
不啰嗦,直接进入主题。
在块设备层注入延迟#
global cnt = 0 ;
probe module("sd_mod").function("sd_init_command") !,
      kernel.function("sd_init_command")
{
    device = kernel_string(@choose_defined($cmd, $SCpnt)->request->rq_disk->disk_name)
    if(device == @1)
    {
        mdelay($2);
        if(cnt % 100 == 0)
        {
             printf("%s inject delay %4d times %7d\n", device,$2, cnt)
        }
        cnt++ ;
    }
    #printf("device %s sd_init_command\n", device);
}

probe begin{
  println("inject_scsi_delay module begin");
}
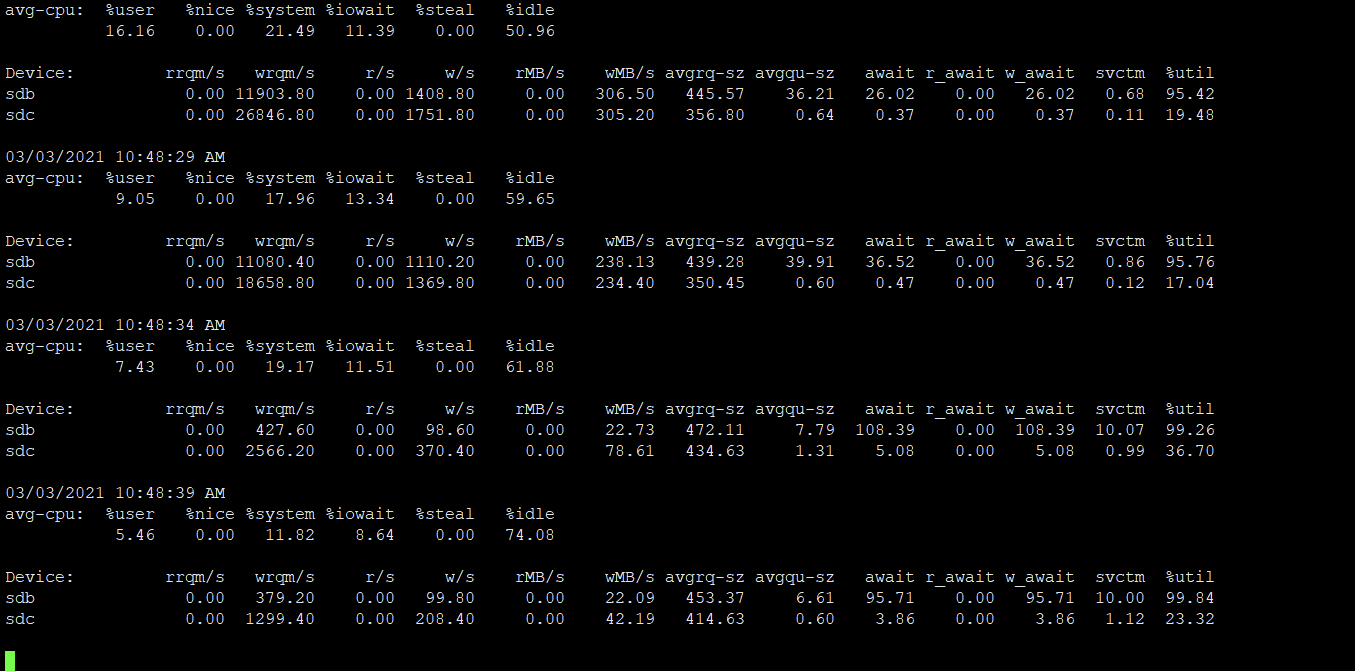
上述文件命名为inject_ka.stp,那么通过如下指令,可以给sdb设备注入10ms的延迟:
stap -p4 -DMAXSKIPPED=99999999 -m ik -g inject_ka.stp sdb 10
staprun ik.ko
或者执行:
stap -g -DMAXSKIPPED=99999999 inject_ka.stp sdb 10
我们可以通过iostat查看效果:
参考文献#
https://sourceware.org/systemtap/examples/io/iostat-scsi.stp
https://sourceware.org/systemtap/examples/io/iostat-scsi.txt